

By Anthony Willmott, originally published on LinkedIn
Farmers don't need to look at the National Drought Map to know whether they're in drought or not - they're living it every day.
And while farmers have a real-life understanding of the impact of drought, many businesses making decisions that affect drought response - often remotely - don't.
In particular, these businesses lack insight or analytics into what's happening at the individual farm or property level, which can differ from how it appears at a regional level.
That's about to change.
New CSIRO-supported data sets have been integrated into the DAS Rural Intelligence Platform™ - the first, complete platform for independent, reliable and robust agri-analytics - and the soon-to-be-launched DAS Rural Property Report™.
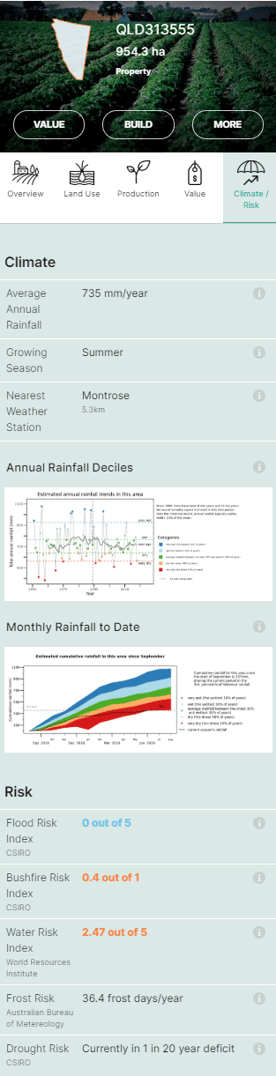
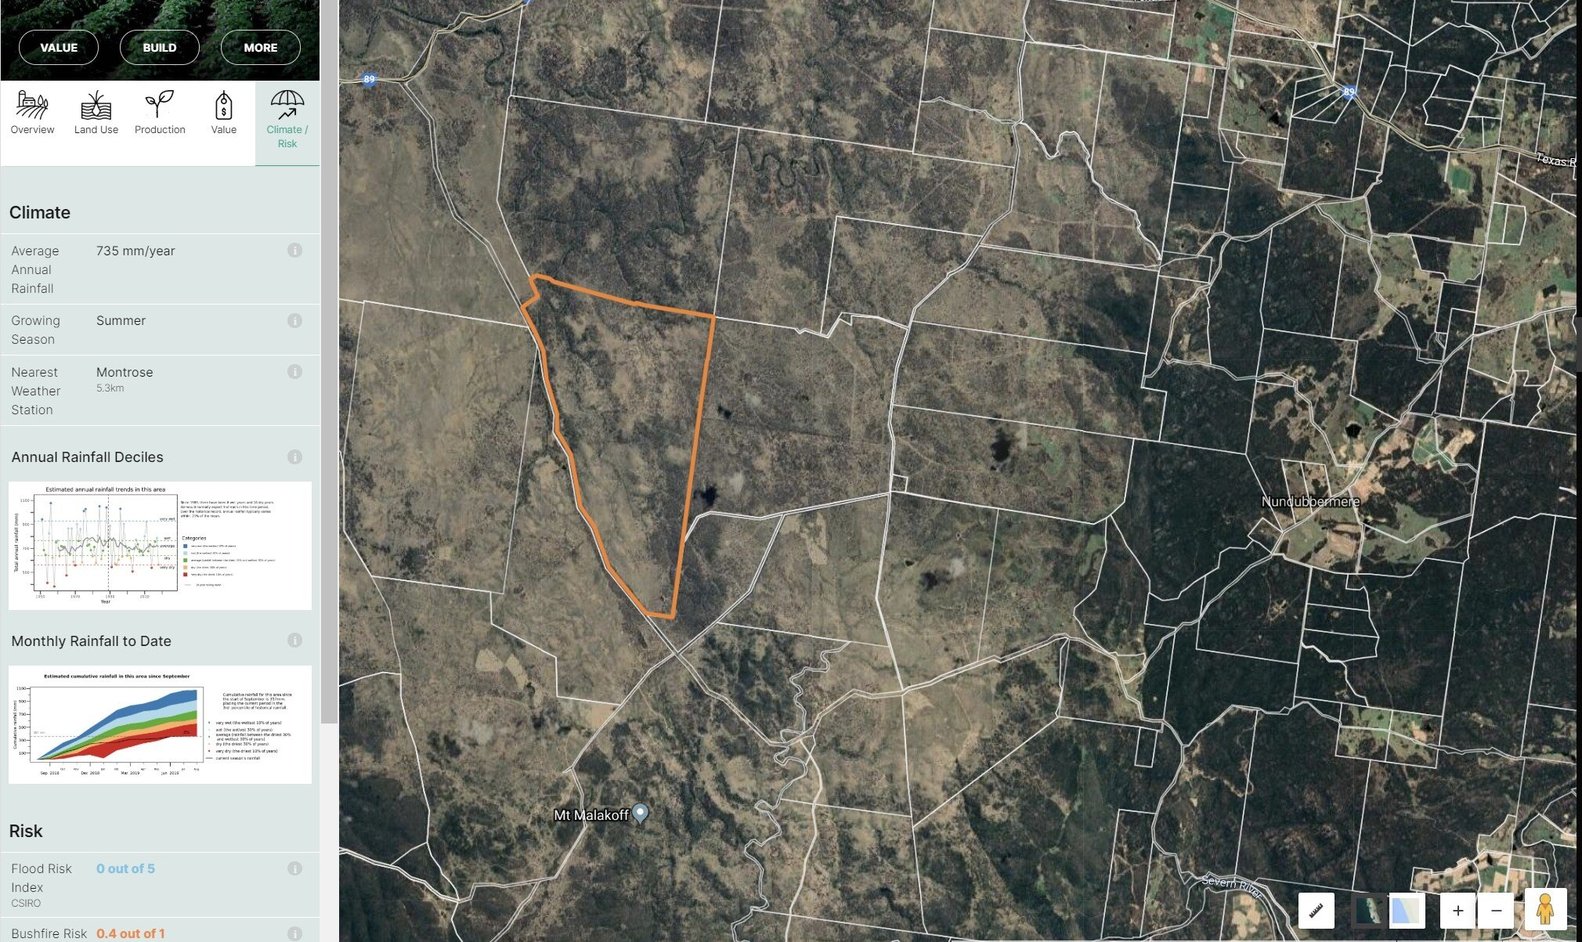
Like all our rural intelligence, the drought stress data set is combined and integrated into a comprehensive database giving a compelling picture of agricultural land in Australia, including property details, productivity, value, land use, climate and risk profile.
The platform can deliver an immediate snapshot of any rural property, including what type of farm; the conditions it is facing; how many properties in any given district are facing drought stress; what kinds of farms are most affected (such as grazing versus cropping) and much, much more.
Why is this important?
Our focus at DAS is on working with business and policymakers - but our purpose and vision is far broader.
We want farmers - whether that's here in Australia or globally - to have greater access to independent insights, backed by science.
Through the DAS Rural Intelligence Platform™, farmers can gain insights on rainfall, productivity, yield and more.
When it comes to drought, the platform makes it possible to source near-instant confirmation or "proof" of drought stress, via a trusted, online platform.
The value is significant. The analytics can be used in conversations with the companies that support farms, whether that's rural lenders or agri-suppliers.
Business perhaps stands to gain the most from these insights.
Right now, the critical question for many businesses up and down the agri-value chain is not whether their customers or suppliers are drought-affected but "How many of my customers are in drought?"; "How will the drought impact supply?" and "How do I better engage directly?" as they extend support.
For instance, businesses can combine DAS analytics with their data to proactively work with customers and suppliers to help them manage through the drought. They won't just know where help is needed, but which customers or suppliers likely need support.
For governments and support agencies, the data is a valuable addition and complement to the existing National Drought Map - which provides deep insights into regions and local areas experiencing drought - assisting with better decision making.
How is this powerful?
Developed by leading CSIRO research scientists and climate science specialists Drs Jaci Brown and Pat Mitchell, the new drought data set responds to the disconnect in information provided to farmers living with drought compared to what is provided to the head offices of businesses and policymakers supporting them.
Companies can now see at a glance just how many of their customers or suppliers are suffering drought stress, and to what extent.
But it's the fact that the data is integrated and automatically connected into one, easy-to-use snapshot that makes this latest addition to the DAS Rural Intelligence Platform™ so compelling.
Users can access data that tells them exactly where they stand, or where their customers or suppliers stand, in terms of rainfall. This is automatically integrated and linked to a range of robust rural data and analytics on any given property.
All kinds of questions can be asked - and answered. How is drought stress impacting the price of rural properties? How long has it historically taken for a farm or region to recover from drought stress? What farm types are most affected by drought stress?
Drought stress must be calculated at an individual farm level
This new capability is just one part of the bigger vision for us at DAS - a vision that includes making it possible to calculate risk in agriculture at an individual farm or rural property level, along with portfolio, district, regional and other levels.
The goal? To increasingly measure physical risk - for drought, bush-fire, flood, water, or even frost - at individual property and portfolio level - integrating climate impacts into risk management and investment decisions.
Like all our rural intelligence, the drought stress data-set is combined and integrated into our industry-first platform, which represents an ever-evolving map and living engine - with rural insights and analytics that are continually enhancing, as machine learning, data fusion and technology itself improves.
What this latest data snapshot highlights:
Drought stress down to a five-kilometre grid or radius. Using trusted rainfall deficit statistics, the new data highlights situations where rainfall is lower over a given period (August 2018 to July 2019) when compared with similar periods over the whole historical period (since 1900). Depending on the level of rainfall deficit, properties are classified as having a "severe deficiency" (eg. one in 20 years) or a "serious deficiency" (one in 10 years). If a property does not have a deficit, the value reads "no deficit". Current rainfall is expressed as a percentile to the historical record.
The data set does not represent an official declaration of drought status, but rather, is part of a broader tool and platform that can be used to inform decision making.
Stay in the loop
Follow DAS on LinkedIn for news and updates related to our products, or subscribe to receive our Quarterly Digest newsletter.