

Understanding rural property markets is becoming increasingly complex. Pricing trends are influenced not only by location and land size, but also by factors such as rainfall patterns, climate exposure, and land productivity. Yet much of the available rural sales data lacks the geographic and environmental context needed to properly interpret transactions.
The DAS Rural Sales Dashboard addresses this gap by combining property-level rural sales data with DAS’ enriched spatial and geospatial datasets. Every settled rural property transaction is mapped directly to property boundaries, allowing users to analyse market activity with far greater precision.
The result is earlier, more relevant insight into rural property sales volumes, pricing, and the drivers of land value — helping lenders, valuers, insurers, investors and agribusinesses make more confident decisions.
A Clearer View of Rural Property Market Activity
The dashboard allows users to instantly explore Australia’s latest rural property sales and analyse transactions across different regions and land types.
Key capabilities include:
- Instant querying of Australia’s latest rural property sales data
- Flexible filtering by sale date, land type, total farm area, and geography — from national level down to regional and Local Government Area (LGA)
- Real-time market insights, including most recent sale dates, transaction counts and total sales volume
- Dynamic charts and maps that update automatically as filters are applied
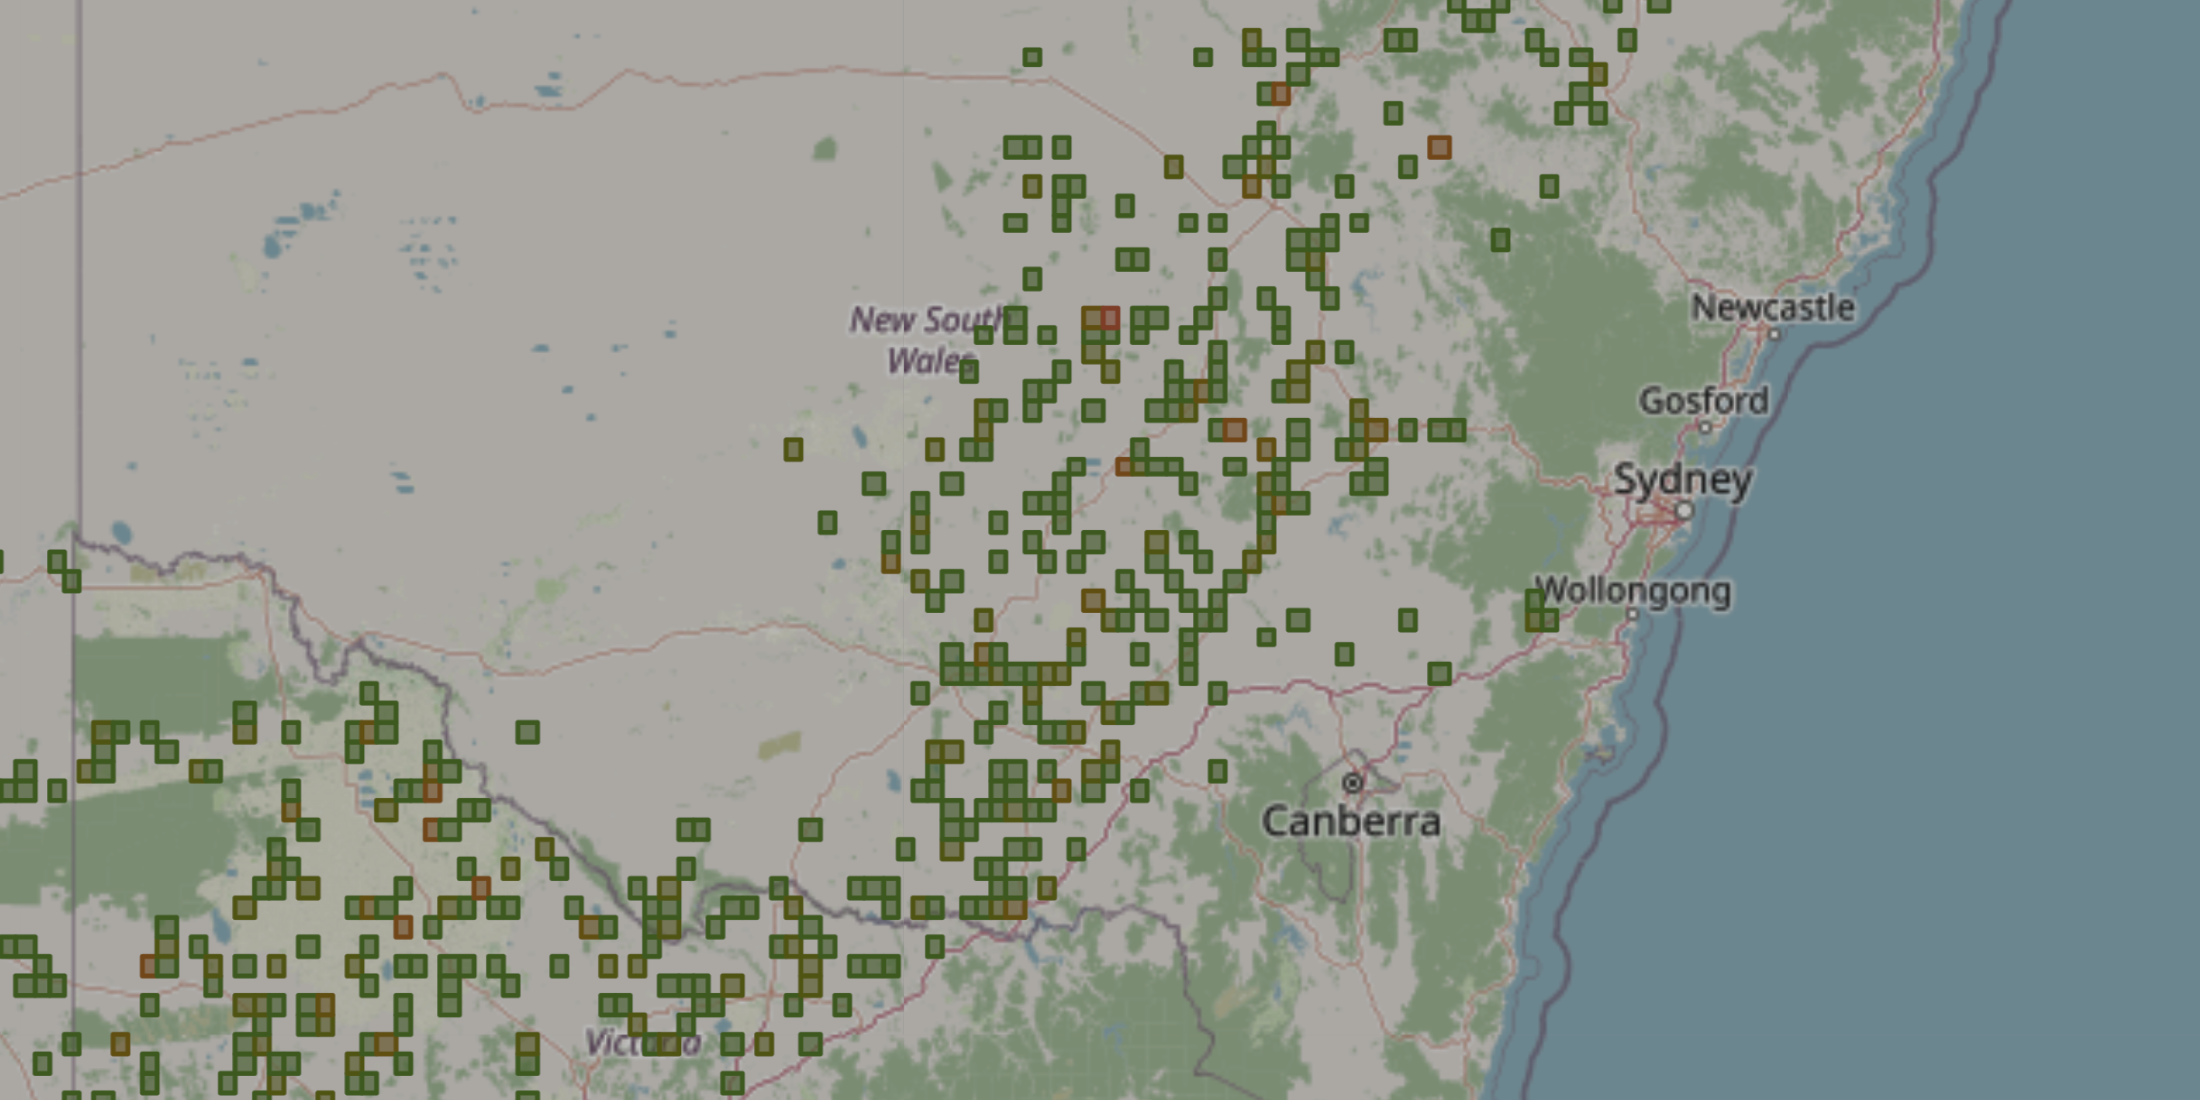
- Map-based exploration showing where qualifying rural property sales have occurred
This interactive approach makes it easier to identify emerging trends, regional activity patterns, and changes in rural property markets.
Understanding What Drives Rural Land Value
Beyond transaction records, the DAS Rural Sales Dashboard helps explain why rural properties sell at different prices.
Each anonymised property sale is linked to contextual land and environmental data, allowing users to analyse how factors such as location, productivity and climate exposure influence price per hectare.
Property-level insights include:
- Land area and land use classification
- Sale history
- Rainfall history and drought exposure
- Slope and elevation
- Climate risk indicators affecting the property
By connecting sales activity with environmental intelligence, users gain a deeper understanding of the drivers behind rural property values across Australia.
Data That Works Beyond the Dashboard
Search results can be easily exported for further analysis or reporting, with options including:
- CSV
- Excel
- JSON
- PNG chart or map exports
This allows rural property sales insights to be integrated into valuation models, internal systems, or executive reporting workflows.
Available as a standalone offering for DAS enterprise customers, the DAS Rural Sales Dashboard provides an independent and transparent way to explore rural property transactions — helping organisations better understand Australia’s rural property market and the factors shaping land value.
Watch the instant demo below or get in touch with our team to get started.